


Does Ontario have hard water? Yes: hardness is 1.5 to 12.9 gpg, hard. Ontario Municipal Utilities Company's 2025 report shows every regulated result under its legal limit with no violations.
Is Ontario tap water safe to drink?
Yes, by the legal standard. The report says "there were no water quality violations during 2025" and that the water met or surpassed all federal and state drinking water standards.
Meeting the legal limits is a system-wide result. The closest result to its limit was nitrate at up to 8.5 of 10 ppm. Your own pipes can change what comes out of your tap, which is why lead is tested at homes, not at the plant.
Every annual report also carries EPA's standard notice that people with weakened immune systems, some elderly people and infants can be more vulnerable to contaminants and should ask their healthcare provider for advice. Boil-water notices are separate, short-term alerts that come from Ontario Municipal Utilities Company directly.
Does Ontario have hard water?
Yes. Ontario Municipal Utilities Company's report puts hardness at 1.5 to 12.9 gpg. That is hard on the U.S. Geological Survey scale.
Hardness depends on the supply: local groundwater averages 124 ppm, imported water 91 ppm, and purchased groundwater 137 to 177 ppm.
Hard Water and Soap Use
Hardness is dissolved calcium and magnesium. The USGS says hardness is not a health concern , but it causes scale, white spots and soap scum. Use the scale below to read a report figure or a home test.
| USGS class | mg/L (ppm) | Grains per gallon | What you'd notice |
|---|---|---|---|
| Soft | 0 to 60 | Under 3.5 | Little or no scale; soap lathers easily |
| Moderately hard | 61 to 120 | 3.5 to 7 | Some spotting on glass and fixtures |
| Hard | 121 to 180 | 7 to 10.5 | Regular scale on faucets, kettles and water heaters |
| Very hard | Over 180 | Over 10.5 | Heavy scale; a softener usually pays off |
mg/L ranges from the USGS Water Science School; grains per gallon = mg/L ÷ 17.1 (see how to convert ppm to grains per gallon ).
Sodium averaged 21 ppm in local groundwater and 39 ppm in imported water; total dissolved solids averaged 227 ppm locally and 215 ppm in imported water, and distribution pH averaged 7.9. Our guide to hardness versus TDS explains why a TDS meter can't stand in for a hardness test.
What is in Ontario water? The 2025 water quality report
The 2025 report shows 11 regulated contaminants detected, each under its legal limit. The tables list each result with its usual source and what reduces it at home.
Treatment plant and distribution system results
| Measure | Result | Legal limit | Where it comes from | What reduces it at home |
|---|---|---|---|---|
| Total trihalomethanes (TTHM) | 47 ppb highest locational running annual average (range ND to 65) | 80 ppb | Chlorine reacting with natural organic matter | Activated carbon; reverse osmosis for drinking water |
| Haloacetic acids (HAA5) | 9.0 ppb highest locational running annual average (range ND to 15) | 60 ppb | Disinfection byproduct | Activated carbon; reverse osmosis |
| Chloramine (disinfectant) | 0.95 ppm average total chlorine residual (range ND to 2.1) | 4 ppm (MRDL) | Added to control microbes | Catalytic carbon filter |
| Nitrate | 2.7 ppm average in local groundwater (range 0.88 to 6.3); purchased groundwater averages 3.9 to 6.1, single results up to 8.5 | 10 ppm (as nitrogen) | Fertilizer runoff, septic tanks, natural deposits | Reverse osmosis |
| Arsenic | ND in local groundwater; purchased groundwater averages up to 2.4 ppb, single results up to 3.1 | 10 ppb | Erosion of natural deposits | Reverse osmosis |
| Measure | Result | Legal limit | Where it comes from | What reduces it at home |
|---|---|---|---|---|
| Fluoride | 0.16 ppm average in local groundwater (range 0.11 to 0.22); up to 0.27 in purchased groundwater | 2.0 ppm (California) | Natural mineral; some utilities add it for dental health | Bone char or reverse osmosis |
| Total chromium | 5.8 ppb average total chromium in local groundwater (range 4.1 to 7.2) | 100 ppb federal (California 50 ppb) | Erosion of natural deposits | Reverse osmosis |
| Hexavalent chromium | 3.9 ppb average in local groundwater (range 2.7 to 4.8); purchased groundwater up to 3.7 | 10 ppb (California) | Erosion of natural deposits; industrial discharge | Reverse osmosis |
| Aluminum | 59 ppb average in imported water (range 39 to 77); ND in local groundwater | 1,000 ppb (California) | Erosion of natural deposits; treatment residue | Reverse osmosis |
| Gross alpha | 3.3 pCi/L in local groundwater; purchased groundwater single results up to 7.3 | 15 pCi/L | Erosion of natural deposits | Reverse osmosis |
Home-tap and PFAS results
| Measure | Result | Legal limit | Where it comes from | What reduces it at home |
|---|---|---|---|---|
| Lead (home taps) | ND 90th percentile; 0 of 50 samples above the action level (2024) | 15 ppb action level | Household plumbing corrosion | A filter certified to reduce lead |
| Copper (home taps) | 0.13 ppm (130 ppb) 90th percentile; 0 of 50 samples above the action level (2024) | 1.3 ppm action level | Household plumbing corrosion | Reverse osmosis |
| PFAS (UCMR 5, 2023) | 6 detected; highest single results PFOA 30 ppt, PFOS 5.2 ppt (averages 1.4 and 0.30) | PFOA and PFOS: 4 ppt EPA limit (compliance starts later); others no federal limit | Consumer and industrial products | Reverse osmosis or activated carbon |
California's limit for fluoride is 2.0 ppm (the federal limit is 4 ppm).
Why does Ontario water have trihalomethanes?
Trihalomethanes form when the chloramine that disinfects the water reacts with leaves, silt and other natural organic matter. Ontario's result was 47 of 80 ppb, under EPA's 80 ppb limit, and haloacetic acids, the second family of disinfection byproducts, were 9 of 60 ppb.
EPA links long-term exposure above the limit to liver, kidney or nervous system problems and an increased risk of cancer. Our guide to TTHMs in tap water covers the health research and removal options.
Is there lead in Ontario water?
Lead at Ontario home taps was 0 ppb at the 90th percentile in 2024 sampling, under EPA's 15 ppb action level. The full result: ND 90th percentile; 0 of 50 samples above the action level (2024).
OMUC says it "completed its lead service line inventory (LSLI) and confirmed there are no lead service lines within the system." EPA's lead guidance notes that lead mainly comes from service lines and home plumbing, not from the treatment plant, and EPA's action level drops to 10 ppb on November 1, 2027.
Where does Ontario water come from?
In 2025 Ontario's water was 64.5% local groundwater from city wells, 27.7% groundwater bought from the Chino Basin Desalter Authority and Jurupa Community Services District, and 7.8% imported State Water Project water treated by the Water Facilities Authority.
UCMR 5 sampling of the distribution system in 2023 found six PFAS at low average levels, with highest single results of PFOA 30 ppt, PFHxA 7.1 ppt, PFPeA 6.7 ppt, PFBA 6.0 ppt, PFOS 5.2 ppt and PFHxS 4.2 ppt. Source water PFAS results for 2025 are also printed. EPA's PFAS page explains the new federal limits and their compliance dates.
How to treat Ontario water: which fix for which problem
Ontario's report is mostly about the chloramine that disinfects the water and the byproducts it forms. Most homes start with carbon for the chloramine and its byproducts, add reverse osmosis for drinking water, and add a softener because the water is hard.
| Your concern | Fix | SoftPro option | Not for |
|---|---|---|---|
| Chloramine taste and smell, TTHMs | Whole-house catalytic carbon | Chlorine+ Carbon whole-house filter , $1,097 | Hardness, nitrate |
| Chloramine plus fluoride | Catalytic carbon plus bone char | Fluoride & Chlorine+ SUPER Filter , $1,267 | Hardness |
| Lead, nitrate, arsenic, PFAS in drinking water | Reverse osmosis at the kitchen sink | Reverse osmosis systems | Showers and laundry |
| Scale and spots | Salt-based water softener | SoftPro Elite water softener , 32K–64K grain, from $1,367 | Chloramine, lead, nitrate, TTHMs |
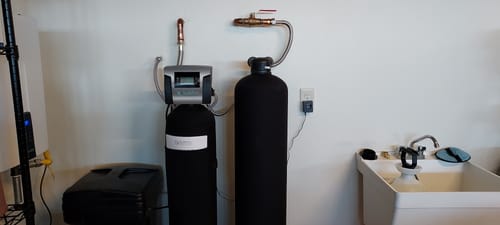
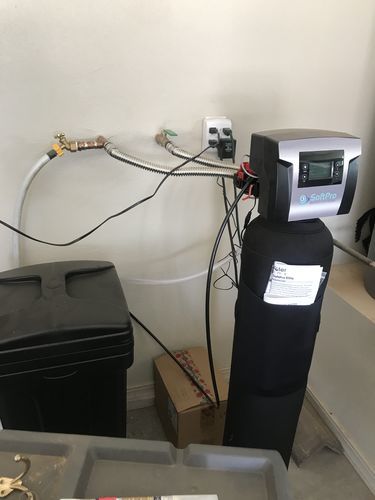
If you want both softening and chloramine removal, read whether to pair a softener with a filter . For Ontario-specific softener picks and sizing, see the best water softener for Ontario, CA .
SoftPro systems are assembled in the USA, ship free in 1 to 3 business days and come with a 6-month money-back guarantee with no restocking fee. Many customers install them themselves, and some hire a local plumber.
How to check your own Ontario water quality and hardness
Start with the utility's annual report, then test what the report can't tell you. The report gives system-wide numbers, and your own pipes can change what comes out of your tap.
- Read the report: Ontario Municipal Utilities Company posts each year's 2025 Consumer Confidence Report and a water quality page . EPA explains how to read a Consumer Confidence Report .
- Test hardness yourself: a strip or drop kit gives grains per gallon. See how to test water hardness at home cheaply .
- Use a state-certified lab for lead or nitrate: test strips aren't accurate enough for these.
- Size a softener only from a real number: grains per day = your gpg × people × 75 gallons. Our guide to calculating hardness for sizing walks through it.
What size softener do I need?
Start from your own tap: Ontario hardness varies by source and neighborhood. Enter a test result, or just your ZIP code, and the calculator returns a free Local Water Analysis Report with a softener or filter sized to your home.
Size my softener + get my water reportOntario water quality: common questions
Is Ontario water hard or soft?
Hard. Ontario Municipal Utilities Company's report gives 1.5 to 12.9 gpg, which the USGS scale calls hard.
Is Ontario tap water safe to drink?
Yes, by the legal standard. Ontario Municipal Utilities Company's 2025 report shows every regulated result under its legal limit with no violations. If you want less chloramine and fewer disinfection byproducts, carbon filtration plus reverse osmosis at the kitchen sink is the usual approach.
Does Ontario water have chlorine or chloramine?
The 2025 report lists chloramine as the disinfectant: 0.95 ppm average total chlorine residual (range ND to 2.1) against a 4 ppm limit. Catalytic carbon reduces its taste and smell at every tap.
Is there fluoride in Ontario water?
The 2025 report shows 0.16 ppm average in local groundwater (range 0.11 to 0.22); up to 0.27 in purchased groundwater, against a limit of 2.0 ppm (California). Bone char or reverse osmosis reduces it if you prefer less.
Where can I find the Ontario water quality report?
Ontario Municipal Utilities Company posts its 2025 Consumer Confidence Report online; the Sources list below links to it. Lead and copper sampling may come from an earlier year than the rest of the report.
Do I need a water softener in Ontario?
Most homes here benefit: the water tests hard, and a softener stops scale and spots. A softener removes calcium and magnesium; it doesn't remove chloramine, lead, nitrate or trihalomethanes.
Sources (checked Nov 17, 2026)
- Ontario Municipal Utilities Company (OMUC), City of Ontario, 2025 Consumer Confidence Report and water quality page .
- U.S. EPA, National Primary Drinking Water Regulations (limits and health effects).
- U.S. EPA, Basic Information about Lead in Drinking Water .
- U.S. EPA, Per- and Polyfluoroalkyl Substances (PFAS) .
- U.S. Geological Survey, Hardness of Water (classification).
